Background
Most healthcare organizations collect patient safety event report data, which describe everything from near misses (a safety issue that almost reached a patient) to harm events (the patient was directly affected). Effectively analyzing these reports is a critical step for understanding where improvements need to be made.
Many organizations collect tens of thousands of patient safety reports and have difficulties analyzing these data quickly to identify relevant patterns and trends. Because the reports also contain a text description, it is not feasible to read each and every report. Consequently, organizations focus only on the small number of reports in which patients have suffered harm. They miss the opportunity to more rigorously analyze the totality of reports where a potential safety issue surfaced, identify patterns and trends before patients are harmed, and act to prevent future harm.
Idea
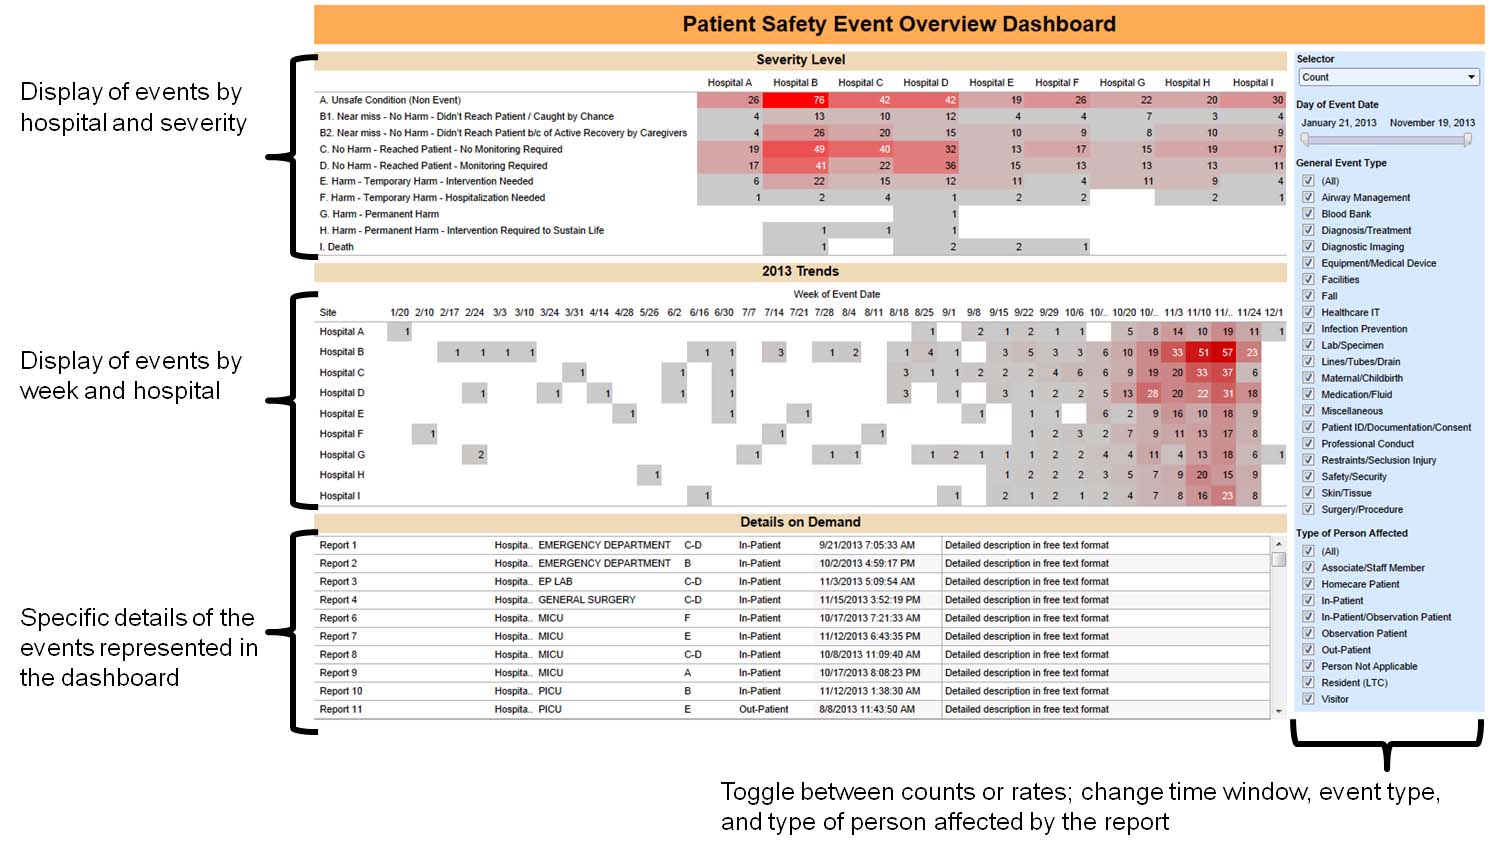
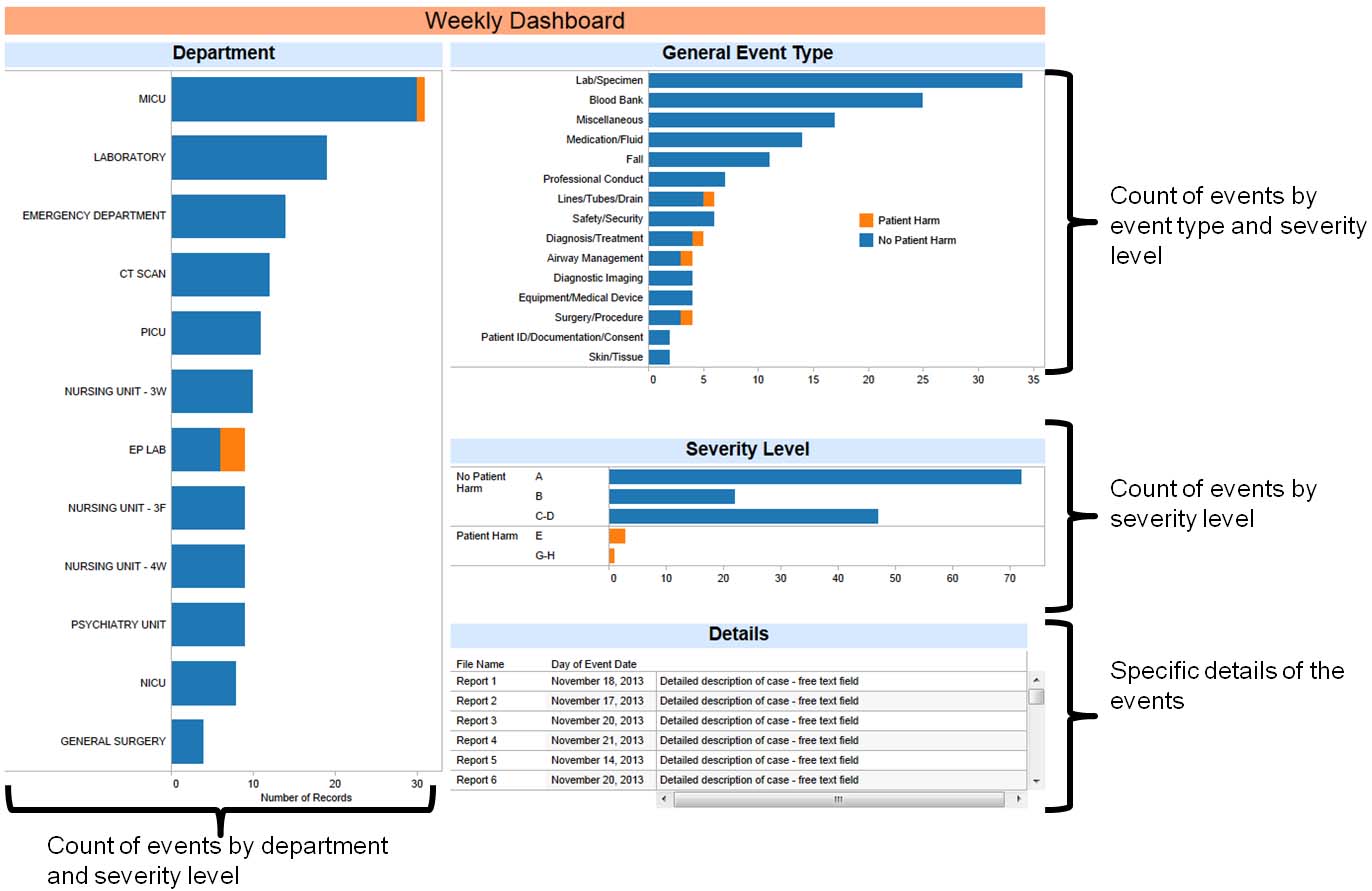
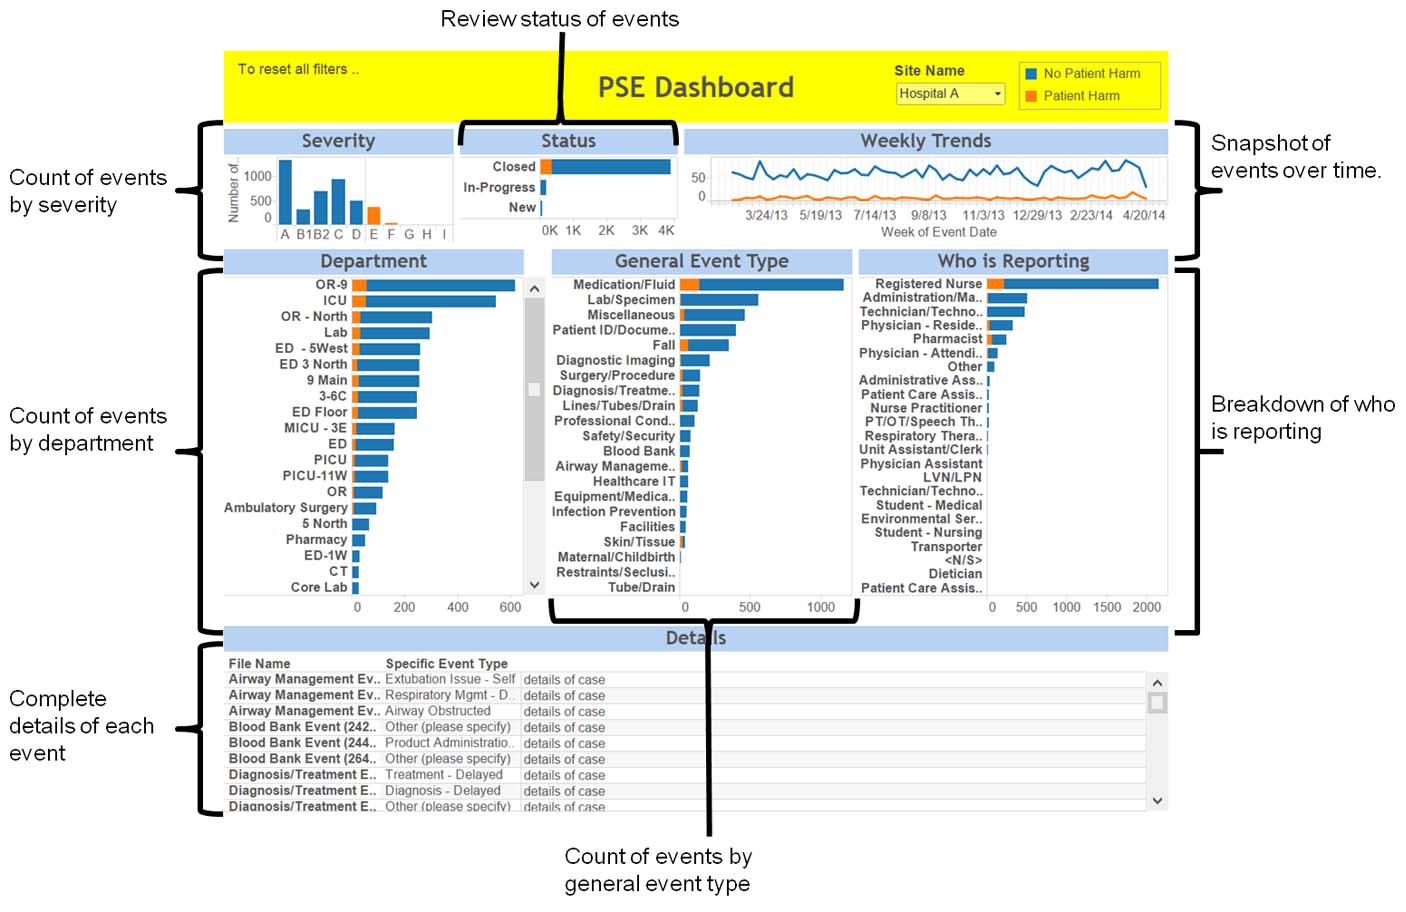
To help address this major challenge, the MedStar Health National Center for Human Factors in Healthcare team has developed an intuitive and interactive safety report visual dashboard. The dashboard allows safety leaders and analysts to quickly explore the data by seeing information at a department level while also seeing global trends across departments. The dashboard helps identify safety hazards more quickly.
We have also used data science techniques to develop algorithms that can more quickly analyze thousands of reports, including the free text, to identify specific themes and contributing factors pertaining to the safety issue. These algorithms rely on natural language processing and other techniques to make sense of the reports in a way that was never before possible.
Impact
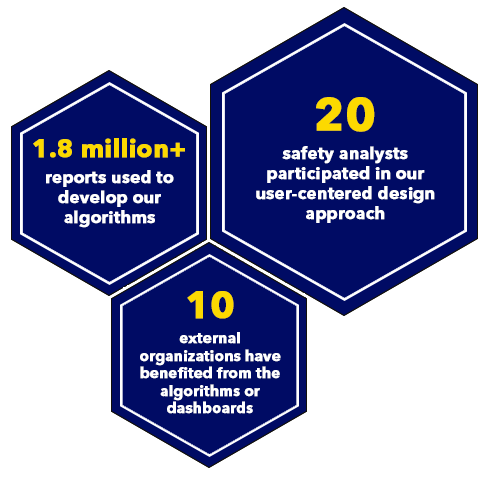
The intuitive dashboard is being used by several safety analysts across MedStar Health and has also been shared with other healthcare systems as a model for how to make these report data more accessible.
Similarly, the algorithms are being applied directly to data at MedStar Health to identify important safety event themes and contributing factors. The algorithms have also been shared with other hospitals including the Children’s Hospital of Philadelphia and the Children's Hospital of Wisconsin.
July 2021 Update
Patient safety organizations are beginning to use the algorithms to analyze their large datasets of reports that are often aggregated from multiple healthcare facilities.
We are now developing algorithms to analyze safety reports from publicly available databases, such as the FDA's database of medical device issues and medication errors. These insights are being integrated with the insights gleaned from healthcare facility patient safety event reports.
Resources
Websites
News
-
MI2 Newsroom, “MedStar Health Human Factors Center to Analyze Nation’s Largest Patient Safety Database to Advance Care”
Publications
-
Patient Safety, “Identifying a Healthcare Organization’s Approach to Safety Event Review and Response Through the Analysis of Event Recommendations”
-
Journal of Patient Safety, “A Machine Learning Approach to Reclassifying Miscellaneous Patient Safety Reports”
-
Applied Clinical Informatics, “Using Active Learning to Identify Health Information Technology Related Patient Safety Events”
-
International Journal of Medical Informatics, “Integrating Natural Language Processing Expertise with Patient Safety Event Review Committees to Improve the Analysis of Medication Events”
-
Journal of Biomedical Informatics, “Identifying Health Information Technology Related Safety Event Reports from Patient Safety Event Report Databases”
-
Journal of the American Medical Informatics Association, “Connecting the Dots: Leveraging Visual Analytics to Make Sense of Patient Safety Event Reports”
Note: The patient information (name, time of admission, age, sex, etc.) presented in the dashboard examples on this page is fictitious.
The overview above reflects work completed while the MedStar Health National Center for Human Factors in Healthcare was part of the MedStar Institute for Innovation. In July 2020, the Human Factors Center transitioned to its new organizational home, MedStar Health Research Institute, and still remains a key collaborator of MI2. Visit the Human Factors Center website for the latest information on its work.
Page last updated: 7/1/21
Page first published: 10/14/20
Summary
The team seeks to effectively analyze and display patient safety event data to help improve interventions.
Team
MedStar Health National Center for Human Factors in Healthcare
Status
Active